

8 min
0
10.04.2022

Mean, median, mode these three terms are the leading indicators in statistical analysis. These values are used by employees of the banking sector, trade, service, and students. More and more abstruse terms such as business analytics, decision support system, neural networks, measures of central tendency, standard deviation, and interquartile range appear in recent years. Yet if you are a student or delve into statistics, then for work, you need to know only about the three terms - mean, median, mode. We will talk about them in the article. If you need homework help with statistics, you can always count on our experts!
Arithmetic Mean - Simple And Brief About Main
Financial analysts and managers often want to get a single number or average value representing an investment decision's likely outcome. The arithmetic mean is by far the most commonly used measure of middle value or data center.
The arithmetic mean is the sum of the given numbers divided by the amount. We can compute the arithmetic mean for both populations and samples. These measures are known as the population mean and sample means, respectively. If you write the arithmetic mean in the form of a formula, it looks like this:
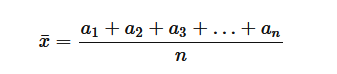
Here x is the arithmetic mean. If you have 5 whole numbers (10,12,5,20,8), then their sum will be 10 + 12 + 3 + 20 + 8 = 55. Since the number is 5, we divide 55: 5 = 11. This is the arithmetic mean.
Practical Example
Let's say you have a store and you are selling something. Per day, revenue ranges from 600 to 1,200 dollars. At the end of the month, you have gained 30,000 dollars in trading. If the conditional number of days in a month is 30, your average daily income is $ 1,000. (30,000 : 30 = 1,000).
Geometric Mean - What It Is And Where To Apply
The geometric mean or proportional mean has been used by humanity in architectural, land surveying, and engineering calculations for at least 2500 years. This is reliably known thanks to Euclid's mathematical treatise "Beginnings." Also, students encounter this term when performing geometry homework.
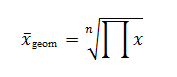
In general, students use the geometric mean less often than the arithmetic mean. However, it can be helpful if you want to calculate a middle number that changes over time. For example, the salary of an individual employee, the dynamics of indicators of success in studies. The geometric mean is obtained from the multiplication of these values, the extraction of the root from this product, the exponent of which is equal to the number of these values:
An interesting fact: there is such an index of human development, with the help of which scientists compare the standard of living in different countries. It is calculated as the geometric mean of several indices.
Practical Example
For example, you bought a share for $ 100, while two years later it was also worth $ 100, and 1 year later - $ 200. The geometric mean of the yield here is 0%. It represents a compound growth rate over the biennium. In particular, the common number is the initial sum multiplied by 2. The geometric mean is an excellent indicator of past performance.
The example mentioned above illustrates how the arithmetic means can skew your estimate of historical performance. In this example, the cumulative return over two years is uniquely 0%. With a 100% return for the first year and -50% for the second, the arithmetic average is 25%.
Median In Statistics
The data's central tendency can be viewed as a value with zero cumulative variance or maximum frequency and, as some mark, divides the ranked data into two equal parts. Half of the original data is less than this mark, and half is more. This is the median.
So, the median in statistics is the indicator's level that divides the data set into two halves. Values in one half are lower, and the other is higher than the median. As an example, consider the normal distribution of the random set of numbers:
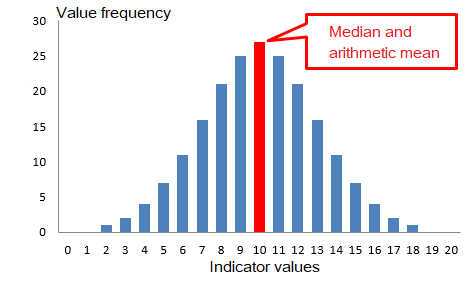
Obviously, with a symmetric distribution, the mean median, dividing the population in half, will be in the very center - in the same place as the arithmetic mean. This is an ideal situation when the mode, median, arithmetic mean coincide and all their properties fall on one point - highest frequency, halving, zero-sum of deviations, average value. However, life is not as symmetrical as the normal distribution.
Let's say you are dealing with technical measurements of deviations from the expected value of something (the content of elements, distance, level, mass, number of values). If all is well, then the deviations are likely to be distributed according to normal. But suppose an important and uncontrollable factor is present in the process. In that case, abnormal values may appear, which will significantly affect the arithmetic mean, but at the same time, they will hardly affect the median. This is seen on the bottom histogram:
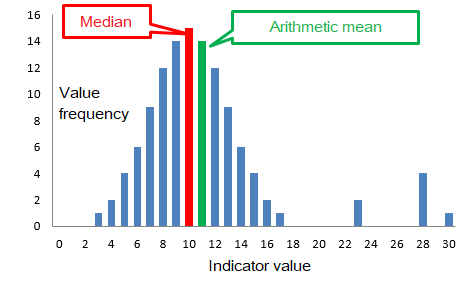
The sample median is an alternative to the arithmetic mean, as it is resistant to abnormal variations (outliers).
The median's mathematical property is that the sum of the absolute deviations from the median gives the minimum possible value. Even less than the arithmetic mean! This fact finds its application, for example, in solving transport problems, when it is necessary to calculate the place of construction of objects near the road so that the total length of flights to it from different places is minimal.
The Formulas of the Median
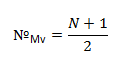
The median formula in descriptive statistics for discrete data is somewhat similar to the fashion formula. The median value is selected from the available set of data, and only if this is not possible, a simple calculation is carried out. The first step is to rank the data. Then there are two options. If there is an odd number, then the median will correspond to the central value of the series, the number of which can be determined by the formula:
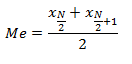
This is the first option when there is one central value in the data. The second option occurs when the amount of data is even. That is, instead of one, there are two main values. The way out is simple: take the arithmetic mean of the two central values:
Practical Example
In math homework, you can find many tasks related to statistics. Consider one of these tasks:
In a country, 1% of the adult population earns 1 million dollars a year, 10% of the population earns 20,000 dollars a year. The rest live below the poverty line, earning only $ 1000 a year. Then, despite the high earnings of 11% of the population, the median will still be $ 1000 because the overwhelming majority receive only $ 1000 a year. Now let's calculate the average:
1% of rape gets $ 1,000,000 = 1⋅1,000,000 = $ 1,000,000.
10% of the rape gets $ 20,000 = 10⋅20,000 = $ 200,000.
89% of rape gets $ 1000 = 89⋅1000 = $ 89,000
This means that the average value per year is:
(1,000,000 + 200,000 + 89,000): 100 = 1,289,000 : 100 = $ 12,890
Such statistics show an accurate picture of the income of the violence. Now you understand why this figure is always mentioned in reports because it in no way reflects the well-being of the majority. Still, it only is an indicator of the economic well-being of the country.
Mode In Statistics
You can find the term most of all in the sample. For example, let's look at the given list of numbers (5,3,1,3,7,5,3,10). There are several number of times 3 in this list. This number is the mode of the given set. If the sample has several modes, several frequently occurring elements, the number of repetitions equal, then this sample is multimodal. For example, consider the set such a set of numbers (1,3,10,3,1,2). Here the numbers 1 and 3 are found the most. In statistics, the mod is applied more about non-numeric data.
Practical Example
If you stand on the avenue and for 10 minutes and count all the passing cars and classify them by color, you can determine the fashion for the color of this city's cars. Let's say you counted 95 white, 45 black, 12 red, 38 gray, and 70 other colors. This means that white cars are fashionable in this city. This is good information for car distributors.
P.S. If you need homework help with math or dissertation statistics help — write us!